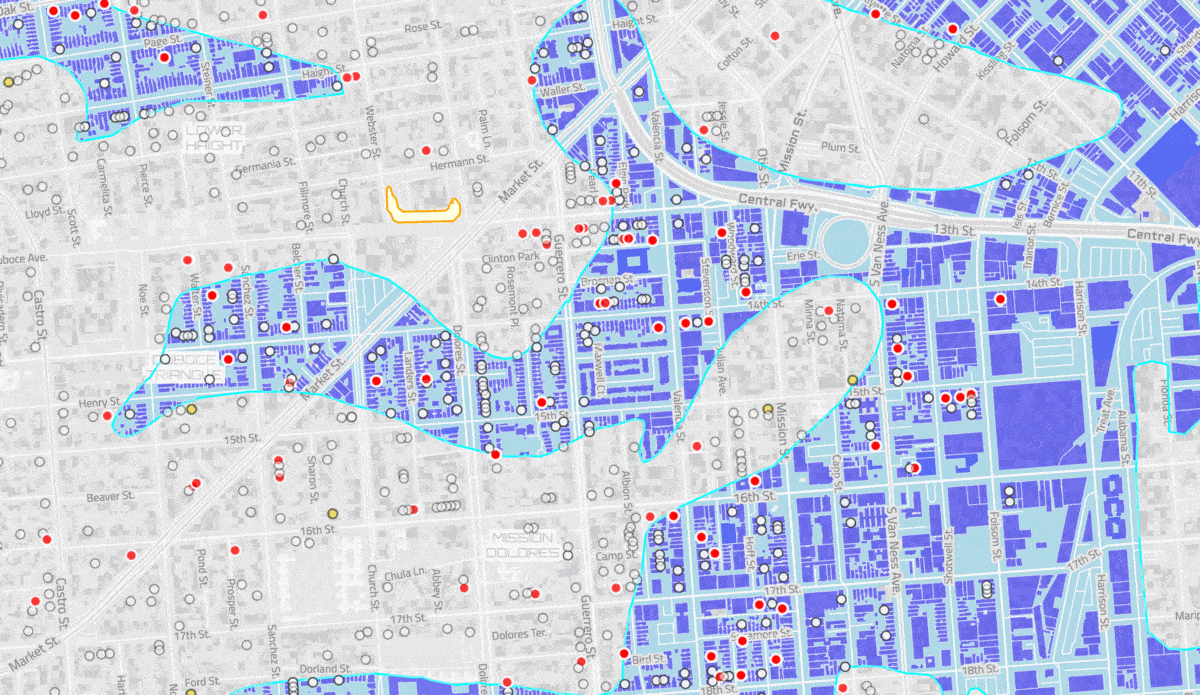
San Francisco building footprints and Soft Story properties intersecting with seismic hazard zones
These maps accompany The Frisc’s article on Soft Story Buildings.
One zoomable slippy map shows population density to seismic hazard zones and other shows building footprints in seismic hazard zones along with properties tagged in the city’s Soft Story Retrofit program
The seismic hazard vs population density map shows
- all census blocks of San Francisco below map zoom level 14, using a Viridis plasma color palette to show differences in density
- it brings in seismic hazard zones at z14 (blue/teal: liquefaction, green: landslide)
- clips out just the census blocks that intersect seismic hazard zones at z15
- shows estimated population per block at z16
- there are 1797 census blocks that intersect seismic hazard zones, for a total of 271,418 people, and 136,680 housing units
The San Francisco Soft Story map shows
- seismic hazard zones below zoom level 15, with teal/blue for liquefaction and yellow/orange for landslides
- at zoom 15, building footprints within seismic hazard zones become visible (update: HERE shut down the Data Hub / XYZ endpoint in 2023, so the layer for building outlines within hazard zones is not loading) along with Soft Story properties with a “Non-Compliant” status are marked as red dots
- at zoom 16, white dots become visible that indicate properties that have been marked as “Work Complete, CFC issued”
- there are also a few yellow dots that represent buildings that are “Work Complete, No CFC issued yet”.)
- these San Francisco datasets were accessed at the beginning of February 2022
These maps are served using Tangram and Tilezen vector tiles. Intersections and density calculations were wrangled in QGIS and data was tiled via HERE Data Hub (formerly known as XYZ).
Notes
- Unlike California’s seismic hazard zone data, San Francisco’s data was not tagged by type of hazard (liquefaction vs landslide). Unfortunately, California’s latest dataset does not yet contain new data for most of San Francisco. However, the feature IDs of the San Francisco dataset show a likely division between landslides (IDs below 300) and liquefaction (IDs above 300), and these seem to match geographic features where these risk are most likely, so we’ve run with this assumption.
- Population density for the Census blocks was derived via area calcualtions using QGIS.
Data sources
These maps take data from several sources:
- San Francisco’s Soft Story Retrofit database
- https://sfgov.org/sfc/esip/soft-story
- https://data.sfgov.org/Housing-and-Buildings/Soft-Story-Properties/beah-shgi
- San Francisco’s building footprints
- map of seismic hazard zones in San Francisco
- 2020 Census Block geometries with population estimates via Census Reporter
Static versions of the extracted clipped data sources are all in this repo’s /data directory.
Screenshots for posterity, for when, like tears in rain, these maps eventually die.